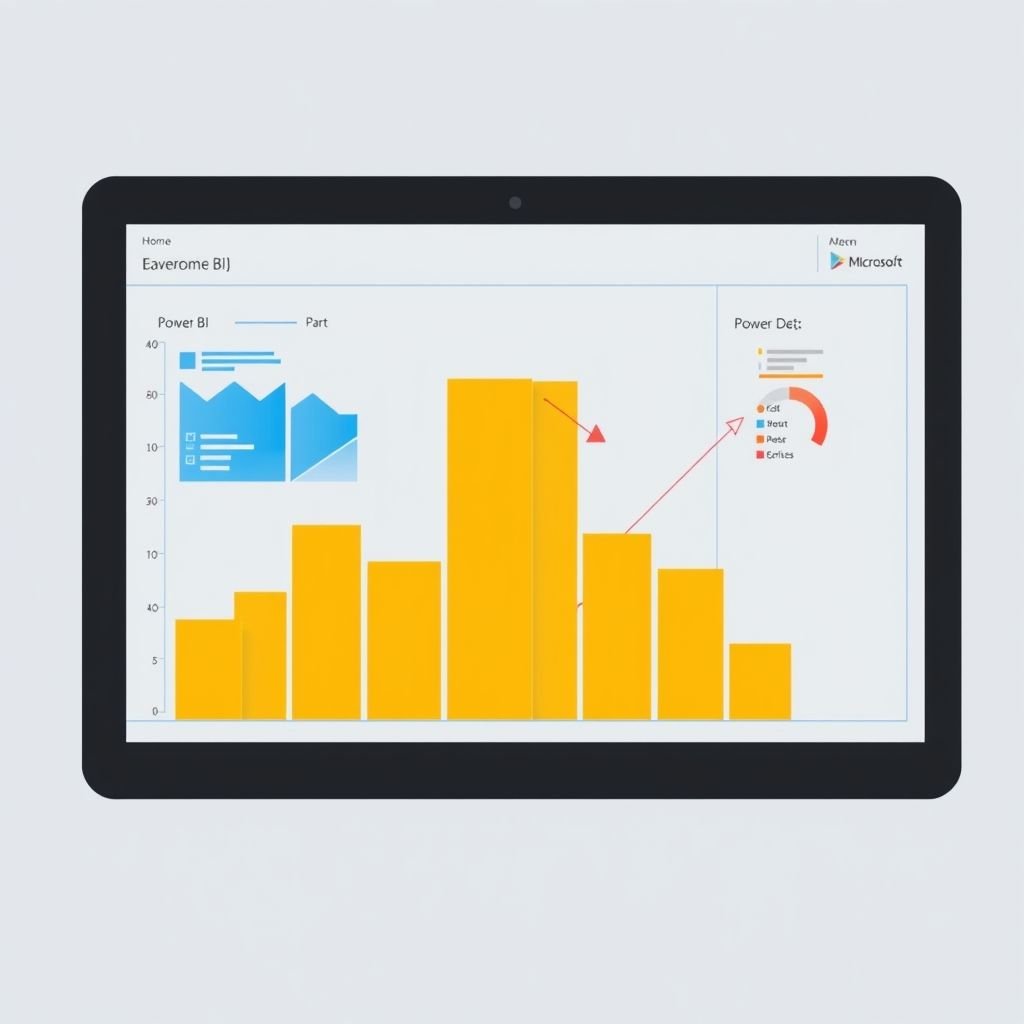
How to Build Insightful Dashboards in Microsoft Power BI

How to Build Insightful Dashboards in Microsoft Power BI
Data visualization is more than just making charts and graphs — it’s about telling a clear story with your data. When done right, dashboards can help decision-makers quickly understand trends, spot opportunities, and make smarter business moves.
Microsoft Power BI is one of the most powerful tools available for creating interactive and insightful reports. With over 500 built-in data connectors, it allows users to pull in data from sources like Excel, Salesforce, Azure, and more — all into one unified dashboard.
Whether you’re new to Power BI or looking to improve your reporting skills, here are key tips to help you create meaningful, user-friendly dashboards.
What Is Microsoft Power BI?
Power BI is a business intelligence platform from Microsoft that enables users to connect, analyze, and visualize data from multiple sources. It supports real-time dashboards, pre-built templates, and team collaboration features, making it ideal for businesses of all sizes.
Now, let’s dive into how to use it effectively.
Best Practices for Creating Powerful Power BI Dashboards
1. Start with Your Audience in Mind
Before building your dashboard, ask:
- Who will be using this report?
- What decisions do they need to make?
- What metrics matter most to them?
Design your visuals around their needs. A sales manager might want revenue trends at a glance, while an operations lead may care more about productivity metrics.
Use clear language, avoid jargon, and tailor visualizations based on the user’s level of technical understanding.
2. Keep It Simple and Focused
Cluttered dashboards can confuse users and hide important insights. Stick to the essentials:
- Limit the number of visuals per page
- Use stacked charts or combo visuals to show multiple data points clearly
- Avoid unnecessary scrolling by keeping everything visible “above the fold”
Remember: less is more when it comes to effective data storytelling.
3. Experiment with Different Chart Types
Not every dataset looks best as a bar chart. Try different visual formats — line graphs, pie charts, heat maps, KPIs, and more — to find what communicates your message best.
Don’t be afraid to test and get feedback from your audience on what works.
4. Master Power Query for Better Data Prep
Power Query is one of Power BI’s most powerful features. It helps clean, transform, and combine data from multiple sources before visualization.
Learn how to:
- Connect to various data platforms
- Filter and reshape datasets
- Automate repetitive data prep tasks
Using Power Query effectively can save time and improve the accuracy of your reports.
5. Make Use of Mapping Features
Power BI integrates with Bing Maps, allowing you to create location-based visuals. To get the most out of this:
- Name your geographic columns clearly (e.g., City, State, Country)
- Ensure data is correctly formatted for geocoding
This helps Power BI accurately plot locations and provide deeper regional insights.
6. Provide Clear Context
Avoid confusion by explaining what the data means. Use:
- Tooltips to give extra detail on hover
- Text boxes to describe key takeaways
- Titles and subtitles that explain the purpose of each visual
A little context goes a long way toward helping users understand the “why” behind the numbers.
7. Guide the Viewer’s Eye
People naturally scan dashboards from top-left to bottom-right. Use this to your advantage:
- Place the most important metric in the top-left corner
- Highlight key numbers with bold text or larger fonts
- Use color strategically (e.g., red for warnings, green for success)
These small design choices help guide attention and speed up decision-making.
Final Thoughts: Make Data Work for You
Power BI gives you the tools to turn raw data into actionable insights — but great dashboards don’t happen by accident. They require thoughtful planning, audience awareness, and smart design.
With these tips, you’re well on your way to building dashboards that inform, impress, and drive results.
Need help getting started with Power BI or improving your current dashboards? We offer expert support for Power BI, Microsoft 365, and more. Contact us today to schedule a consultation!


